Magnetic Anomaly Detection
Geplaatst op ma 22 augustus 2022 in Blog
Introduction
It seems possible to determine explosions by monitoring the Earth magnetic field. This method is applied by Richard Cordaro. An example for the explosion at the Saky airfield in Crimea.
Anyone who feels like helping me (Richard Cordaro) look for magnetic anomalies from the war, here is the Excel spreadsheet program, and my demo video (boring, but informative). Happy hunting.
Richard Cordaro provided an additional video explaning the calculation in more details. This video is really helpfull to understand what values to fill in into the correlation coefficient formula. Note: Richard states during the explanation that there are 3 cells < 0.4, but that's not the case. There are only 2 cells < 0.4, but for the explanation that doesn't matter.
Richard subtracts the daily minimum value from the other daily measurement values, but technically that is probably not needed. Just check.
City sensor codes
| Country | City | Code | Remark |
|---|---|---|---|
| Austria | Vienna | WIC | |
| Bulgaria | Panagjurishte | PAG | |
| Poland | Warsaw | BEL | |
| Romania | Bucharest | SUA | |
| Ukraine | Lviv | LVV | |
| Turkeye | Istanbul | IZN | Not selectable |
Procedure to Process for Magnetic Anomaly
Richard Cordaro (RC) provided a procedure how to obtain and process the data.
Formula behind the run button is not simple. I encourage you to try the method in whatever code you wish. Psuedo code is as follows:
- Get the 24 h magnetometer record 1440 points.
- Interpolate to get a point every 30 sec. (2880 pts).
- Run the explosion pattern past the record measuring the
correlation coefficient (cc) (or explanation 2) at every step.

Correlation coefficient formula 
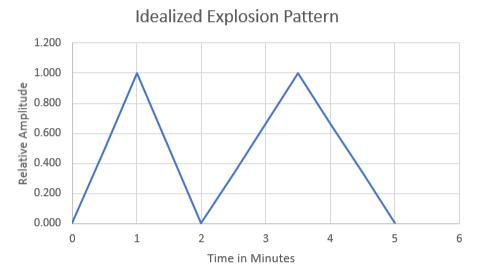
Idealized explosion pattern - Set a threshold (minimum) correlation coefficient to aim for.
- If the correlation coefficient is greater than the level you choose make note of the time.
- Step through your results in 30 sec steps.
- Count the the number of correlation coefficients you kept within the next 5 min.
- Assign that number to the time at beginning of the 5 min interval.
- Plot counts vs times. This is the graph.
A little bit more information:
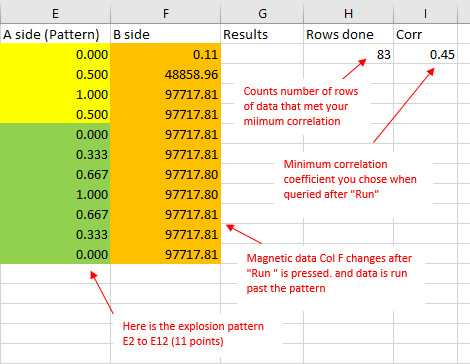
In the image below, a bit more is explained. The explosion pattern (11 points , "samples") in Col E stays still and the data runs past it in Col F. Yes, rolling 5 minutes (11 samples). So 'n' is 11.
The y data (in the formula) is the data in the table Y column, however I subtract the daily minimum to make the numbers smaller. The x data is not time, but the amplitudes of the explosion pattern = 0, 0.5, 1 ,0.5 , 0, 0.33, 0.67, 1, 0.67, 0.33, 0. (11 points). So n=11 and we get the correlation coefficient as we run through the y data 11 points at a time. When we get to magnetic data number 2870, we are correlating pattern to points 2870 to 2880. Done.

For me this is still not clear enough.
Data
The data is provided by Intermagnet.
Someone wrote a Python script to obtain and normalize the data.
Instructions
The following instructions are obtained from the spreadsheet, that is referred to above:
- Go to: Intermagnet
- Choose Date, Time, Observatory, Plot "Magnetic Field (XYZ)", Scale "Fixed", Output format: Accessible HTML Table
- Press "Plot Data"
- Copy the result into the spreadsheet
- Click 'run' below (in the spreadsheet)
RC: Here is a link to my procedure for extracting magnetic anomalies from explosions (and rocket launches).
RC: I use only the By (eastward) magnetic field component. Started with By a long time ago and just kept using for consistency. Other components might work. Will post procedure.
Leszek: RC takes only eastern part, which is y column. As explosions are on the east. X can be interesting as well